Who wants to bet whether it'll be a random YouTube video with either a Breitbart or American Thinker article?Originally Posted by Daruwind


Who wants to bet whether it'll be a random YouTube video with either a Breitbart or American Thinker article?
Fact:Apples taste good, and you can throw them at people if you're being attacked
Under the patronage of big daddy Elfdude
A.B.A.P.
I don't see anything there that proves CO2 is the primary driver for climate change. Would you like to try again?
What's surprising is that the article actually admits that there warmer periods in the Holocene than present day. Oh, how the world is changing.
As requested, another random u-tube video that disproves the IPCC's claims about CO2:
https://www.youtube.com/watch?v=Vk4MuaeQi14


Here...are some videos - https://www.youtube.com/ (yes, it is actually right link) that disprove anything you say/write. Naturally you can find them yourself and then I expect you to present us with detail analysis why you should be right. Unless you do so, I conclude we won the argument.

------
This is similar level of commitment..+/- don´t you think guys?
That's a lot of videos, but I didn't see anything about CO2 there. However, the video recipe for hamburgers by Cowboy Ken Rollins looked pretty good.
B.W. it was joke. My point is, you try to post various videos without delving into details or at least once trying to prove your argument and position over at least one case. But because Geneva keeps demolish your position every time with wall of text and reasons and data, you try to bring up again and again various videos before jumping to new case. What about defending one video for longer time? Discussing over it? Because they might be nice starting point but hardly end point....Just idea. You actually made my point very clear. There is Youtube video for anything even recipe for hamburger. :-)
You've won nothing and proved nothing. You guys are the ones who ignore the information in the videos and articles I post. You're right on one thing, Geneva puts up a wall of text and articles and each time I go through them it always comes down to the source material being based on manipulated data. How about coming up with something that hasn't been tinkered with? You can't. Everything that supports your position is tainted and Climate Gate proved it.
I asked Geneva if Happer was falsifying any information in his lecture. Never got a definitive answer.
And you, instead of commenting on the information in the last video as to its authentic nature, you merely posted a link to dozens of video that had nothing to do with climate.
Climate Gate should have been a wake up call for you man-made global warming zealots, but no, you just covered it up with more disinformation.
The one thing I know that none of you here who are arguing the cause of AGW is that globalism and your celebrated cause are tied at the hip. The 1997 chart symbolizes the seminal moment that "science" went totally political. Every UN IPCC funded study and paper from that time has been corrupted and co-incidentally that is the same time that globalism went rabid with Clinton boxing up whole factories and shipping them to China. I know, I saw it happen.
The problem you've got is that Globalism in its present form is dead and the UN along with its associated organization WHO have been shown to be completely useless in the Corona virus crisis. New climate models are being designed as I write this that will factor in associations that the previous models did not. When they come out you are going to be in the uncomfortable position of defending so vigorously "scientific studies and papers" that were so heavily tilted by massaged data.
Now, go back and watch the last video and point out the problems with it. Maybe then we can have a discussion.
Actually I have:
https://www.twcenter.net/forums/show...1#post15867490
As I said, Happer didn't have produced any data on the topic. He simply cherry-picked information.
IPCC funded? The IPCC doesn't have the budget to fund scientific researches. It is a participate process reviewing the scientific literature.
https://www.ipcc.ch/site/assets/uplo...te_IPCC_en.pdf
You should know the basics before to express an opinion
CMIP6 models?
https://advances.sciencemag.org/content/6/12/eaaz9549
https://agupubs.onlinelibrary.wiley....9/2019EA000975
Greenland could have been warmer during the Neolithic indeed. It doesn't mean it is the globe that was warmer.What's surprising is that the article actually admits that there warmer periods in the Holocene than present day. Oh, how the world is changing.
This is because insolation over the Arctic peaked during the early Holocene and is decreasing for millenia. So Greenland temperature from isotopic proxies were higher than today because locally Greenland was receiving more sunlight (yellow figure):
What is interesting however is that even with this proxy overestimating the temperature in the past millenia, the last 2500 years doesn't show up as warmer than today.
Again the link: https://www.carbonbrief.org/factchec...climate-change
We clearly have a hockey stick trend emerging from the data, counteracting several millenia of decreasing insolation on the Arctic.
This is better seen hereI don't see anything there that proves CO2 is the primary driver for climate change. Would you like to try again?
Radiative forcing ‐ measured at Earth's surface ‐ corroborate the increasing greenhouse effect
https://agupubs.onlinelibrary.wiley....9/2003GL018765
Global atmospheric downward longwave radiation over land surface under all-sky conditions from 1973 to 2008
https://agupubs.onlinelibrary.wiley....9/2009JD011800
Infrared radiation and planetary temperature
https://geosci.uchicago.edu/~rtp1/pa...odayRT2011.pdf
Increases in greenhouse forcing inferred from the outgoing longwave radiation spectra of the Earth in 1970 and 1997
https://www.researchgate.net/publica..._1970_and_1997
On the causal structure between CO2 and global temperature
https://www.nature.com/articles/srep21691
https://phys.org/news/2016-02-eviden...an-global.html
Observational determination of surface radiative forcing by CO2 from 2000 to 2010
http://asl.umbc.edu/pub/chepplew/jou...eldman_CO2.pdf
Dependence of global temperatures on atmospheric CO2 and solar irradiance
https://www.researchgate.net/publica...lar_irradiance
Global Warming and Global Dioxide Emission: An Empirical Study
https://www.researchgate.net/publica...mpirical_Study
Why natural cycles only play small role in rate of global warming
https://www.carbonbrief.org/guest-po...global-warming
A limited role for unforced internal variability in 20th century warming
https://journals.ametsoc.org/doi/abs...18-0555.1?af=R
Human and natural influences on the changing thermal structure of the atmosphere
https://www.ncbi.nlm.nih.gov/pmc/articles/PMC3808612/

LOTR mod for Shogun 2 Total War (Campaign and Battles!)
https://www.youtube.com/watch?v=bIywmAgUxQU
First of all. You never answered the question of whether or not Happer falsified his data. You side stepped it, because if you admit that he didn't falsify his data it means you're wrong.
Secondly, I've already told you about posting a wall of text, links, videos, etc.
In the past I've taken the time to go through them and found that they were all based or formulated on manipulated proxy data.
With that in mind, I took the first video and watched it twice. What a piece of spin! Not only does it support and defend the use of manipulated data and tries to white wash the Climate Gate affair, it calls us skeptics conspiracy theorists. In fact, it's full of trigger words that little indoctrinated minds respond to nodding their heads in unison.
Here's a few thoughts on the "conspiracy":
https://www.climatedollars.org/full-...ls-the-debate/
And lastly, I'm not impressed by your cheering squad. They simply nod their heads collectively and approvingly when seeing a wall of text, links, etc. as if that in itself is proof when it is entirely composed of misinformation.
Happer does not produce any data, nor any figure. He uses what the others produce. He did use misleading figures like those from John Cristy but he didn't produce them himself. And most of the time, he simply cherry-picked data and use sophistic arguments. Like those:
https://climatefeedback.org/claimrev...l-projections/
https://climatefeedback.org/claimrev...de-plant-life/
Using also Godwin points:
https://twitter.com/existentialfish/...18036169986054
Which is completely absurd, nobody is demonizing CO2. We are saying we shouldn't continue the accelerating trend of increasing atmospheric CO2. The increase is the problem. Happer uses a strawman argument.
Another sophism is when he is arguing that CO2 is not a pollutant because CO2 is good for plants. Nitrate is also good for plants, but nobody denies there is a strong pollution associated with nitrate! The same for noise or thermal pollution. The concept of pollution is rooted in toxicology and ecotoxicology, it is the dose that makes the poison. Saying there is a pollution doesn't mean the active component of this pollution is bad in all cases.
https://en.wikipedia.org/wiki/Noise_pollution
https://en.wikipedia.org/wiki/Thermal_pollution
When you believe that the proxy data suits your narrative, you have no issue to share it here. But when it contradicts you, it became "manipulated proxy data".
LOTR mod for Shogun 2 Total War (Campaign and Battles!)
https://www.youtube.com/watch?v=bIywmAgUxQU
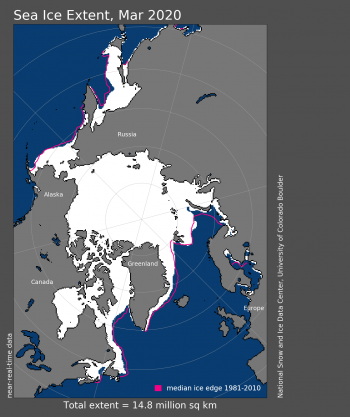
But...but...but...It's not supposed to be there. Highest sea ice since 1988:
https://wattsupwiththat.com/2020/04/...th-surrounded/
1) But you realize it is just about one part of world...like that Bear Island?
2) Have you read whole article? Last Graph... Just that you can nicely see long term trend here.
There is even nice link
http://nsidc.org/arcticseaicenews/20...polar-sunrise/
But i quess we are all good because Bear Island has a lot ice.Through 2020, the linear rate of decline for March extent is 2.6 percent per decade. This corresponds to a trend of 40,500 square kilometers (15,600 square miles) per year, which is roughly the size of Massachusetts and Connecticut combined. Over the 42-year satellite record, the Arctic has lost about 1.66 million square kilometers (641,000 square miles) of sea ice in March, based on the difference in linear trend values in 2020 and 1979. This is comparable in size to the size of the state of Alaska.
I´m merely quoting from link which was on page you linked....So I quess you checkmated yourself? Again?The March 2020 Arctic sea ice extent was 14.78 million square kilometers (5.71 million square miles). This was the eleventh lowest in the satellite record, 650,000 square kilometers (251,000 square miles) below the 1981 to 2020 March average and 490,000 square kilometers (189,000 square miles) above the record low March extent in 2017.
At the end of the month, extent was particularly low in the Bering Sea after a rapid retreat during the second half of the month. Ice loss was also prominent in the Sea of Okhotsk and Gulf of St. Lawrence.

I wasn't trying to hide anything or manipulate any data. According to climate alarmists that ice was supposed to be gone 10 years ago, but instead what we have is somewhat normal variables.
The day before yesterday all the weather forecasters where I live were ballyhooing about how great the weather would be for the next few days. It was going to be glorious they said. Last night a severe thunderstorm came up and lasted all night long (it was so bad I'm going to have to check my roof for damage).
So, yesterday evening one forecaster came on and let it slip out that all the computer models were wrong and they had no idea where or how the storm came about. Did you get that? All the computer models were wrong! These were models that forecast regional climate for a week or so at a time, never mind the complexity of forecasting the world's climate for the next fifty years.
And yet, AGW proponents tell us that their computer models are infallible. It's just ridiculous.
You do realize that just maybe model for a few day forecast is different to long term model? ;-) Short term weather is heavily depending on initial measurements. In ideal world you would need sensors every few meters on land, in air, basically 3D net to calculate evolution and problem is, there is no such sensor grid plus no supercomputer to solve the evolution in real time. In real world you can never predict weather for 100%. Read this https://en.wikipedia.org/wiki/Butterfly_effect
If you understand this, you would not write such nonsence from physics point of view.the butterfly effect is the sensitive dependence on initial conditions in which a small change in one state of a deterministic nonlinear system can result in large differences in a later state.
But please be my guest and find similar long term report for whatever place you live in.
O M G
I think there is no way to describe your message by both being objective and respecting the forum rules.
Weather forecast and climate forecast are two different things using different methodologies. But besides this, your message fails to understand a basic principle of probabilities and statistics.
Let me illustrate it with a very simple analogy: Heads or Tails.
Imagine you want to forecast what would be the result of 10 coin tosses.
There are two outcomes possibles, heads or tails. Theoretically there is no reason for one or the other to be more likely. The probabilities are 50/50.
So in an ideal situation, the forecast should be 5 heads, 5 tails. But anyone that played this knows that very often we see very different outcomes.
If you got 7 heads and 3 tails, this is not extraordinary. But actually it is very different from a forecast of 5/5, this is even a huge error proportionally.
Now repeat the process but for 1000 coin tosses. If you got 700/300 it would be really extraordinary. Actually you have often a very small margin of error, something like 510/490.
In this case the error is proportionally very small. So why there is such a difference between the two forecasts?
This comes from two interrelated things: sample size and random variations.
Random variation has bigger effect on smaller sample and random variations are random, which means they are sometimes higher in value, sometimes lower and sometimes exact.
The bigger the sample and the bigger the number of occurrences, in this case coin tossing, the lesser it has an effect. Because random variation compensate each other. The higher values are compensating the lower ones.
In the case of weather and climate forecasts, there is a similar difference. Random variations are especially the result of inherent uncertainties in the measurement. Your values are sometimes higher than the reality, sometimes lower. The same for your forecast, like the number of rainy days in a week, sometimes higher sometimes lower. Sometimes correct. But when it comes for climate, these day-to-day variation and mistake in the forecast doesn't count that much because you are looking for monthly or yearly averages. By averaging, most random outcomes will compensate each other.
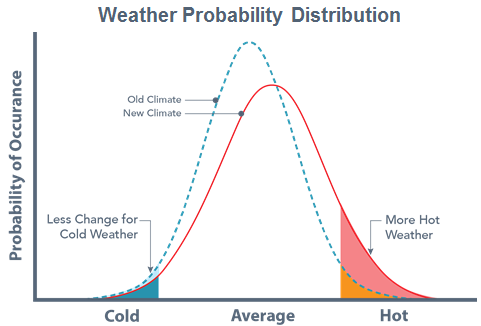
What is climate? Basically it is the probability function of weather events, ideally this is what we want to know. In the context of climate change, we want to understand this shift in the probability functions.
LOTR mod for Shogun 2 Total War (Campaign and Battles!)
https://www.youtube.com/watch?v=bIywmAgUxQU
Nothing like a summer solstice snowstorm to put the chill on the global warming hoax:
https://www.accuweather.com/en/winte...montana/761490
Now say "summer solstice snowstorm" ten times as fast as you can.

Dude B.W. you put curse on me... got down to 5 degrees (Celsius) here; and this is meant to be 'Neverwinter Land'; you know 'down under'; 'crocodile dundee-', 'mad max' 'kangaroos' etc...
How I wish for a bit of that Global Warming! LOLOL
Being the Weatherman must be a great job because even if all your pretty 'Weather Probability Distribution' tables/graphs are wrong and you call 'Sunny Day' and it turns out 'Thunder-storms & lightening' you can be wrong every single time and still never loose your job...I bet in RL Genava is a 'Weatherman' :->
Last edited by Stario; June 18, 2020 at 11:17 PM.
You two should learn something about statistics.
 Posting Permissions

 Reply With Quote